Building tools for VR scientific visualization – VR Volume viewer
by Camilo DiazMission of the 3D visualization team at CCV
CCV has worked in scientific visualization since its inception back in 2003, collaborating with multiple departments and faculty members to display 3D datasets on multiple devices such as display monitors, VR HMD, mobile devices, browsers and multi-display CAVE systems. Examples of our work include terrain visualization of the Mars Galle crater for the department of planetary science, high resolution tiff imagery and VR poetry for the literary arts faculty and 3D representations of human hearts for biomedical engineering classes. It is our objective to do research on the best tools to implement these types of applications, going from open source libraries to free to use 3D visualization tools such as blender, paraview and Unity 3D. We also follow software engineering standards to ensure sustainable maintenance and produce efficient and effective products. Historically, we have worked in the OpenGL rendering pipeline to place these datasets into 3D scenes. This library has been fully optimized for triangle mesh indexing and rendering 3D content for interactive real time simulations. Most of the time the programmer only needs to focus on implementing tools to apply transformation to those triangles and facilitate the manipulation of objects by the user.

Volumetric datasets
However, some of our collaborators reached out to us looking to display 3D volumetric datasets such as medical images in DICOM format, density of gasses in a volumetric space and temperatures in the ocean. Rendering this type of data in 3D space is a challenge due to the type of algorithms needed to map scalar values to voxels (a voxel is the 3D version of a 2D pixel).

Volumetric Ray Marching
The most used algorithm is the ray marching technique. It consists of representing the data inside a unitary cube placed in the center of the scene (position x=0,y=0,z=0). After that, a ray is created from the camera to position in the direction of the cube location, and walk on the ray in small steps until it reaches the cube. At the ray-cube intersection point we can query the value from the data and move in the ray another step. If we find a different value, we can interpolate or take the maximum between the previously observed value and the new one. We continue moving in the same direction until we have traversed the cube. The accumulated value is converted into color space and passed to the fragment shader to paint a colored-voxel on screen. As you can see, no triangles are needed to render this type of dataset.

Challenges and solutions
Now we have the knowledge on how to deal with volumes, but we still face a couple of issues:
- By the brief description on how the algorithm works, we can imply that walking on the ray is a loop, and it needs to be run for every pixel in the application viewport. The performance of an application running it could easily go down depending on the size of every step and the screen resolution.
- The size of the original volumetric dataset affects the amount of memory needed to run the application in both RAM and VRAM. We have had datasets in the order of 1.8 GB which is difficult to load on a standard PC.
- There are many applications in the scientific visualization ecosystem that can do volume rendering. However, the data needs to be exported to their proprietary file format, or the application has terrible performance. The worst cases are when the application crashes with no output logs or ways to debug it.
- Back in 2017-2018, the number of applications that supported VR mode was extremely low, and most of them were proprietary software with no world space UI in order to modify the scene in real time.
The clear solution for us was to implement our own Volume viewer that supported VR and embedded a GUI in both 2D and 3D. Back in 2019, I worked alongside previous CCV engineer Benjamin Knorlein to build an application that could run volume visualization in any type of display systems, as we did for many previous applications. We wanted to have control on how the algorithm performs, debug it, optimize it and add new features as required.
The product
After 2 months of research and implementation, we were able to come up with a volume renderer prototype implemented on top of Brown University in-house custom graphics engine MinVR. The main use of this engine was to run custom applications in the famous virtual reality teather - YURT. A multi display system that consisted of 69 projectors, a visualization clustered of 20 nodes with 4 nvidia-quadro buffer graphic cards on each one and a real time moving tracking system. We extended the engine to support VR mode using the open source library OpenVR and we added our own raycaster implementation using the modern OpenGL pipeline including fragment shaders and asynchronous texture upload to avoid long loading times and lock the application for several seconds.
The results
The first prototype was able to load and render tiff stacks as volumes in grayscale. Most of our initial tests gave us a decent frame rate performance between 60-70 fps. In VR mode we were getting some jittering in the volume at the moment we rotated the camera, and some z-fighting depending on the point of view. Also, the application did not have enough interactivity with the user, only the camera movement (paneling, zoom). The data was being loaded using the command line arguments. The next iterations of the prototype included new features such as GUI on desktop mode and world space UI on VR mode, user interaction using VR controller (translate and rotate model), camera animation for multiple views and video exporting.


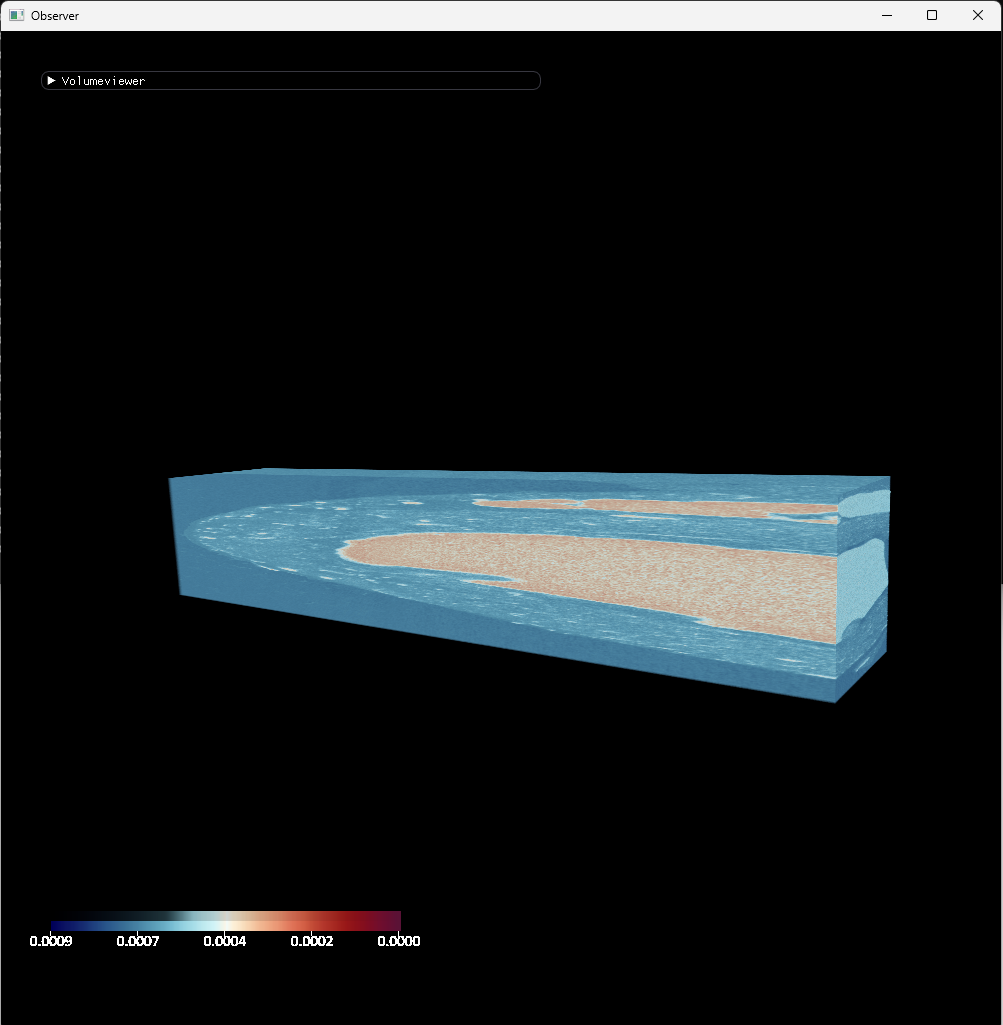
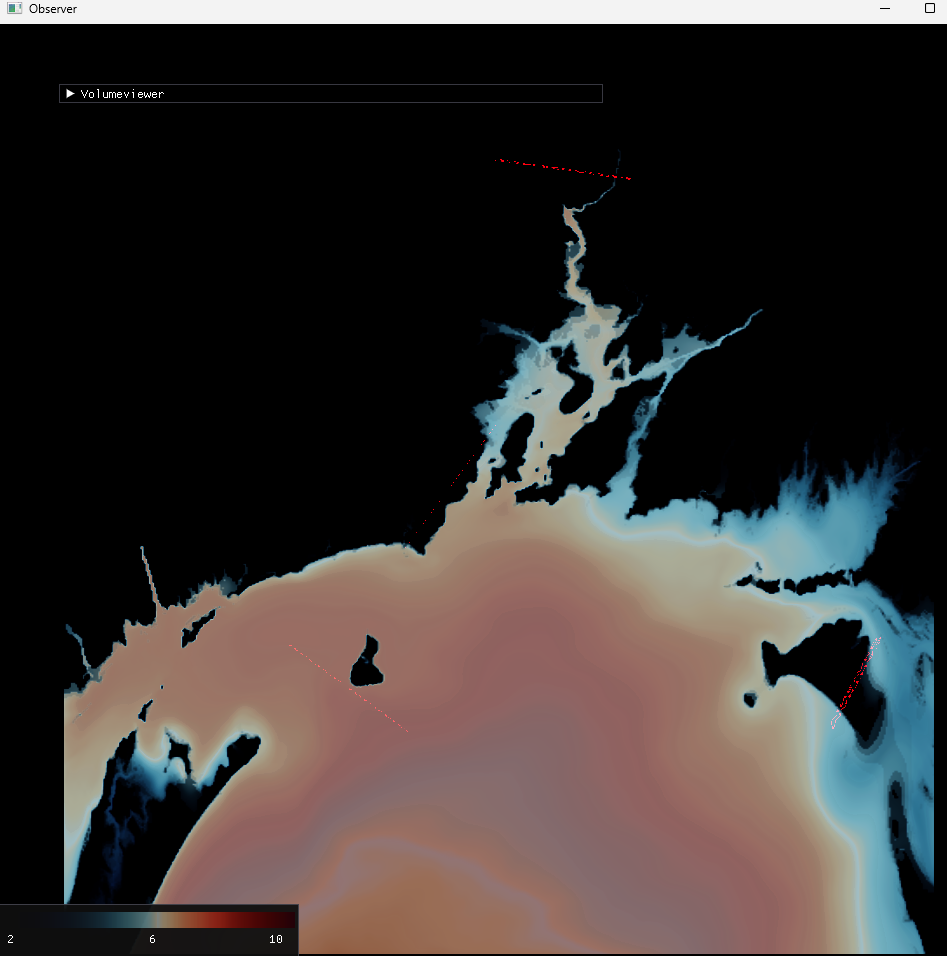
This is a demo of the temperature and salinity of the Rhode Island narragansett bay represented as volume data. Our tool is able to render mesh and volume data at the same time for a full 3D representation of the terrain plus the surrounding ocean.

Conclusion
It is important to research the types of tools available for easily visualizing 3D data. However, it's equally vital to understand the rendering techniques and algorithms these tools employ. Gaining an understanding of, and being able to implement ray marching enabled our team to quickly develop a tool that meets our specific needs. This tool can be maintained according to established software engineering standards.
